(8.40am, 17/11/22) First of all (and I promise not to do this every post!) I just wanted to mention that my new book Numbercrunch: A Mathematician’s Toolkit for Making Sense of your World was announced this week - see the story in The Bookseller. The publication date (hardback, ebook, audio book) is 2nd March 2023, and I’m very excited about it.
That done, it’s on to the weekly COVID numbers. As before, I will update this post later on Thursday and Friday, to take account of dashboard and ONS numbers. People receiving this by email will need to check in on the website version I think - I don’t want to spam you all every time there’s an update!
Last week I talked about things being “fairly encouraging, but perhaps with a faint cloud on the horizon”. This was largely based on tracking the variant percentages, and in that sense it feels to me like the cloud is getting bigger.
That is, thanks to Dave McNally’s posting variants by level we know that we’re now up to about two thirds of sequenced genomes being at “Level 5 or above” (here, the Level refers to the number of mutations from a collection which are commonly occurring at the moment - in general, the suspicion is that the higher the level the bigger the growth advantage). Indeed, these Level 5 and above strains appear to be showing growth in absolute terms (note, this is different to a relative growth advantage, and arguably more important in predicting future waves).
The growth of these strains themselves in isolation is not incredibly fast - doubling in 2-3 weeks - which puts an rough upper limit on how fast the total case growth could be even if they completely took over. For what it’s worth, Dave’s page suggests that 15% of UK genomes are now BQ.1.1, which is now our leading variant.
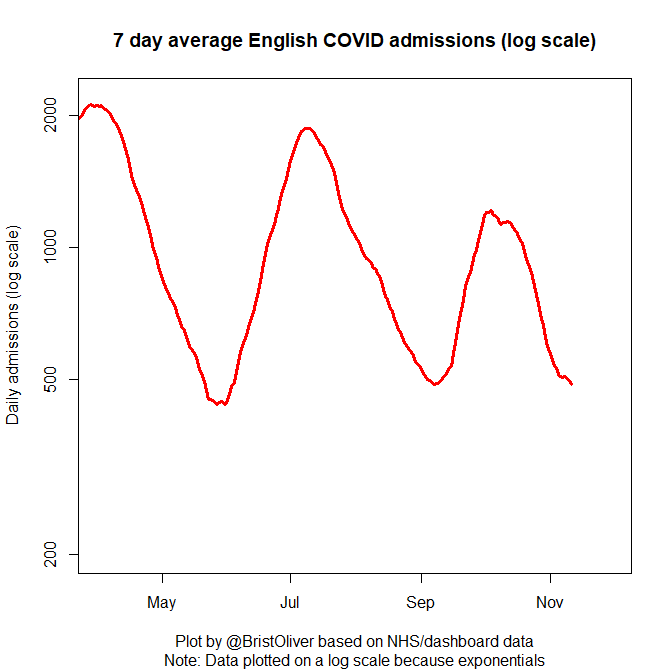
So, in terms of the hospital admissions picture, I would say that this may be close to bottoming out now. That is, you can see that the red line (of absolute numbers) isn’t dropping anything like as fast as in previous weeks, though has managed to fall from 537 to 487 in the course of the last week.
And in terms of the blue line which tracks week-on-week admissions ratios, it’s clear that the trend isn’t in the direction that we’d like. Most of the newly announced case ratios are in the 0.9 range, and there’s even one point showing absolute growth.
So, I’d say definitely one to keep an eye on (though not to panic about - admissions numbers are still low, and we’re not so far from the Christmas break!) at this stage.
(4.10pm 17/11/22) We can look at another blue line, on the case ratio graph, and see a similar picture. Remember that values below 1 mean that the numbers are falling - so what you can see is that case numbers are falling, but not falling as fast as they were. Since a bigger proportion of admissions are incidental than they were in pre-omicron days, it’s perhaps not surprising that the two blue lines are displaying similar characteristics at the moment.
(Midday, 18/11/22) And just to round off the week’s data, here’s ONS. Big drop, but worth remembering this is “week ending 8th November” so may not reflect the latest developments. Still nice to be back under a million.


