


UK COVID data, week starting 21st November 2022
Glass half-full, glass half-empty time

(8.30am 24/11/22) Over the last couple of weeks, I’ve been talking about how the rate of decline of admissions has been slowing, and the percentage of the variant soup that’s formed by faster growing variants has been increasing. For what it’s worth, this is mainly BQ.1.1 - now at about 17% of sequenced genomes - though also others in the Level 6 and 7 families contributing as well.
Well, I think it’s fair to say that admissions have now bottomed out. They aren’t growing yet, but they have stopped falling and are now flat, and I don’t think it’s unreasonable to guess where that might go next. (This week’s latest seven day admissions figure is 474, last week’s was 478. Statistically speaking, it’s a dead heat).
You can see it particularly clearly on the admissions ratio plots: of the new data three points are above the critical “1” line, four are below it.

So, as I’ve been saying for a while, I’m not expecting anything at all that even faintly resembles a sudden swing into the crazy omicron type growth we saw a year ago and calls for a cancelled Christmas again, but I do think we are just on the threshold of returning to some amount of growth in the coming weeks.
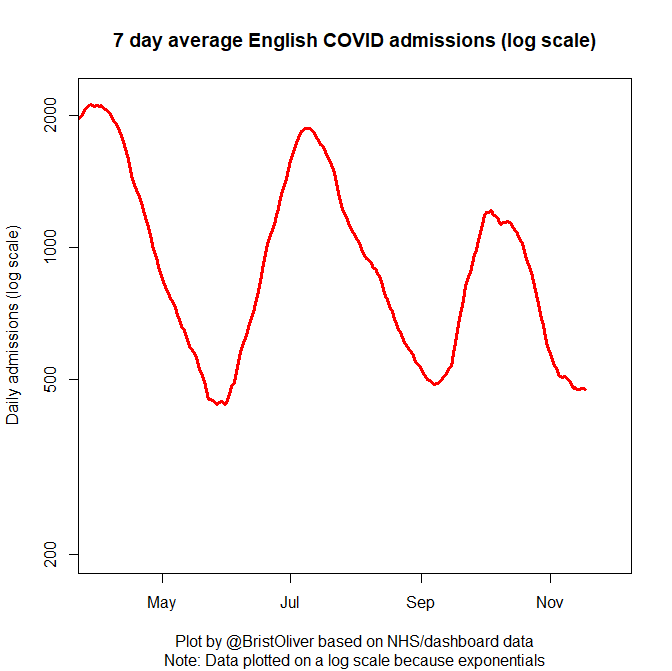
(1:20pm 24/11/22) Incidentally, I find it fascinating to look at the whole course of the pandemic on a single graph on a log scale. (Or nearly the whole course - the hospital admissions series starts too late into March 2020 to see the whole first wave).

It’s very striking just how anomalous the wibbling around (on a really tight range) from July to December 2021 was - most of the time the trends have been very linear. Pre-omicron, you can see two big drops and a little one, caused by two long lockdowns and a short one. Since then, there’ve been a succession of short and sharp in-and-out waves (mostly coinciding with new variants taking over - though perhaps not the most recent one).
(4:00pm 24/11/22) Updated with (specimen date) case ratio. A similar picture really, getting closer and closer to absolute growth, but just about hanging on the right side of the line for now.

(Midday: 25/11/22) And finally, the weekly ONS infection survey shows another welcome drop, though perhaps with a hint of starting to slow down as well (remember there is a lag on this - this refers to “week ending 15th November”, so not as up-to-date as the case and admissions data above)
