


UK COVID data, week starting 23rd January
O Brother, Where Art Thou?

(9am, 26/1/23) Last week was a short but extremely optimistic summary of the COVID data (of course bearing in mind that since December 2021 we have been in a sequence of short but fairly sharp waves, meaning that whenever we’ve been in retreat it hasn’t been so long before we’ve gone back into growth).
This week, the picture is slightly more mixed. Last Thursday I said that ZOE incidence was 95k. Indeed, it continued to drop for the next few days, getting as low as about 83k, but has since gone into reverse and currently lies at 105k. I never know quite how seriously to take it, and I’m not at all sure about how they are smoothing and fitting those numbers, but it’s at least a straw in the wind perhaps.
In terms of variants, the XBB.1.5 strain which got a lot of media attention early in the New Year continues to grow, but not as fast as when it first arrived. Back then, it was doubling in share roughly weekly, but this has dropped back to fortnightly doubling.

Obviously any amount of increase is bad, but I don’t think the percentages are ever going to be stable, and so the best we can hope for is that the variants that come in don’t arrive with a huge growth advantage which allows them to cause a big wave. So in that sense XBB.1.5 is still out there, still growing (up to about 10% now), and so it probably wasn’t realistic to imagine that falls at the very rapid rates of January would continue too much longer.
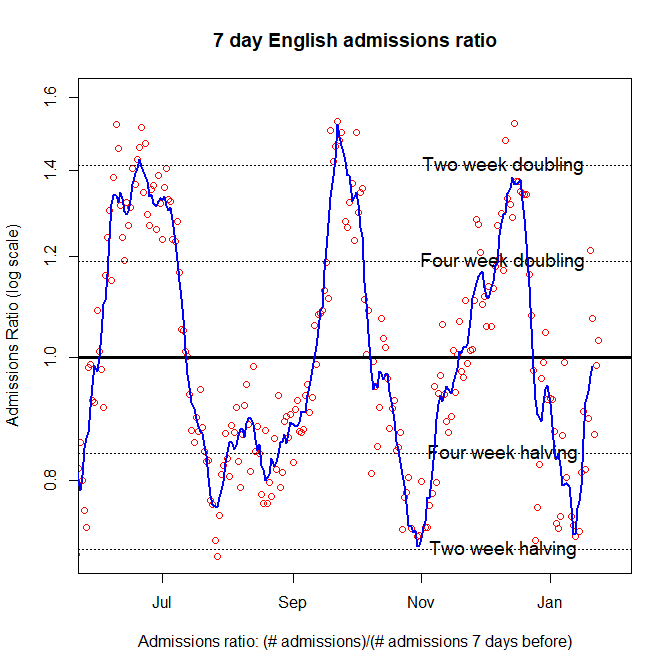
And indeed we can see from the new admissions data that things appear to have bottomed out - the latest week’s data is essentially flat.

But with the blue “admissions ratio” curve heading back up towards 1 (over 1 equals growth, remember), it’s pretty tempting to guess where we might be heading next.
(6.35pm 26/1/23) As noted by Adele, the overall picture is slightly more complicated, with a rise in hospital-acquired admissions more or less balancing out a fall in community admissions.


And that’s backed up to some extent by the fact that positive tests have continued to fall this week (nearly all points below the solid line), but that the rate of fall is much slower (blue line coming up).

So it’s not panic stations by any means, but back to “may be worth keeping half an eye on soon” territory I think.
(Midday 27/1/23) ONS showing an extremely significant drop, though as always worth bearing in mind that this is lagging data - it refers to “week ending 17th January”. But still, nearly back to the level of previous troughs.
