UK COVID data, week starting 28th November 2022
Down the gutter in the drain, Back to wherever they came
(9am 1/12/22) First of all, apologies for the radio silence here in the last week. I’ve been busy with other things, including writing something for another outlet, and so I’ve not had time. But I’ve been enjoying reading some great free Substack content from various people, and still happy with my choice of Twitter lifeboat.
Anyway, onto this week’s data, and the question of where we go next on the rollercoaster ride of sharp ups and sharp downs that has been COVID 2022 (albeit at a much lower level of deaths than in previous years, just as you’d expect now that so many people have been vaccinated and infected).
So, anyway, as I’ve been saying for the last 3 weeks, a return to growth was on the horizon because of the rate of growth in absolute terms of BQ.1.1 and other Level 6 and 7 variants. This is … what we see in this week’s hospital plots.
Here is the blue “admissions ratio” curve - the last couple of points are 27% or so week-on-week growth.
Personally, I don’t think it’s a cause for panic - it’s not so many weeks until the Christmas break when transmission at schools and work will drop right off - but it’s a reminder that there is still a certain amount of this stuff out there. Certainly compared with this time last year, given that we’ve had so many omicron waves which have naturally topped themselves out it doesn’t seem at all reasonable to assume that we’re going to be back into the world of NPIs. Though of course, more pressure on the NHS is never welcome, even at the best of times, which this clearly isn’t.
(9.30am 1/12/22) Because it’s the first Thursday of the month, we also have the latest ONS Long COVID data (randomly sampled and self-reported, before anyone says anything). Note that there was a methodology change marked by the vertical dotted line, so you can’t compare “before” and “after” figures directly.
Anyway, following a small drop in numbers last month, this latest release shows an increase in the number of people reporting that their ability to undertake their day-to-day activities had been “limited a lot”. This increase may not be a complete surprise because it counts people on 6th November who’d had a reported or suspected infection four weeks previously, which takes you back into the September-October peak above. So it definitely seems like one worth keeping an eye on in future reports, to see how this number changes with subsequent waves and troughs.
(4pm 1/12/22) The latest dashboard data shows cases returning to modest growth as well, so the picture seems pretty consistent across data sources.
(Midday 2/12/22) Just to complete the set, the ONS also saw a return to modest growth. As usual this lags, and technically you might argue that since the last two confidence are overlapping so really we might be flat still. But realistically, lined up with the other graphs above it’s probably another sign that we are back into modest variant-driven growth.
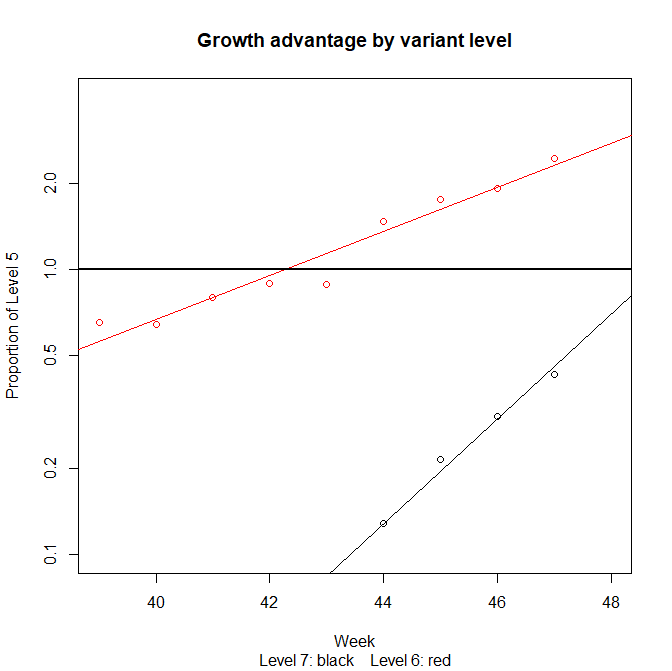
Just to explain this a bit more, here’s a plot using data reported by Dave McNally showing the percentage of variants of different levels (showing different numbers of mutations). It appears that variants at Level 5 are roughly flat in absolute numbers, but Level 6 and 7 are currently outgrowing that reference point, giving the overall growth we have seen.


Is there anything to stop these recurring waves going on for ever ? At the moment it seems the NHS never gets a chance to return to "normal". Do we need much more effective vaccines and/or treatments before we can live with Covid at tolerable levels ?