UK COVID data, week starting 6th February
Movin' on up now

(9am 9/2/23) Another brief update this week - I’ve been busy again, including with book-related things, as my thread of endorsements continues to grow (thanks everyone!). Today marks three weeks until publication day, so it’s a good time to place a Numbercrunch pre-order.
COVID-wise, first of all, ZOE got rebased this week. So, while it’s plausible that proportional day-to-day changes are comparable to before (the methodology doesn’t change over short periods of time), I’m much less convinced than previously that there is signal as well as noise in the ZOE daily incidence numbers, so I’m going to stop talking about them for a while.
So, what other leading indicators do we have left? An obvious one is the variant percentages. There the leading contenders are CH1.1 and descendants (blue), XBB.1.5 (red) and the new kid on the block XBB.1.9.1 (green).

They are all growing, but there’s a sense in which some variant will always be growing, so I think the more important question is “how fast are they growing?”. For comparison, I’ve added in the (absolutely crazy) rate at which omicron (black) first took over from delta.
Another way of seeing this is to look at Alex’s variant pressure graphs, which capture the rate at which new variants are increasing the overall growth rate. His estimate of current variant pressure (kind of “acceleration”) is 0.07% - compared with 0.24% in February 2022 and 0.29% in June 2022, for example.
So it’s clear that there is growth, but not as fast as before, as each strain struggles to carve out a competitive advantage relative to things like BQ.1.1 which helped cause the last (pre-Christmas) wave. As a result, my current expectation is for us to be in some kind of growth phase for a while, but not growing fast enough to threaten the kind of 2,000 admissions-per-day peaks that we saw in the omicron BA.1 (January 2022), BA.2 (April) and BA.5 (July) waves. We’ll see though.
However, this seems to be borne out in the latest admissions data, which continues to rise, but not very fast, even compared with the September and December waves (which weren’t very fast themselves).

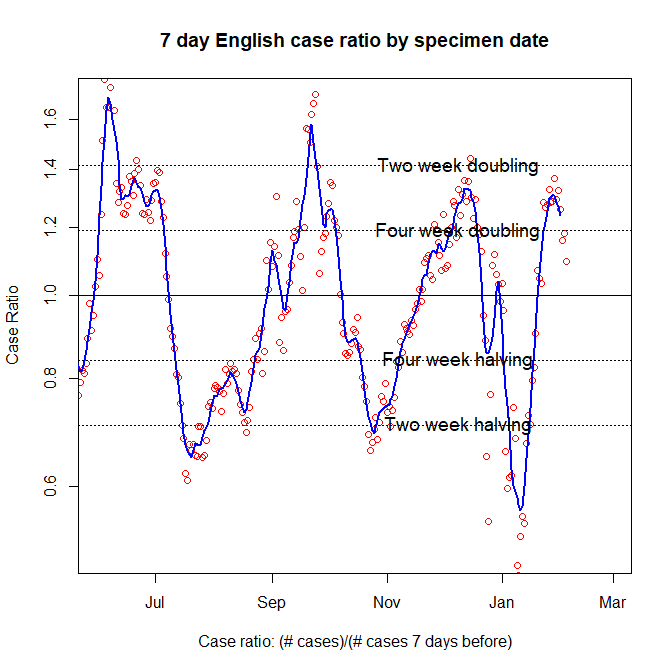
And the blue line (telling us about the rate of increase) looks encouraging too - in the “slower than four week doubling” range, and pointing downwards.

(4pm 9/2/23) A similar picture from dashboard cases, where there is slower growth this week than last week.
Though as I mentioned last week, it’s not surprising that cases and admissions are tightly coupled these days, since a sizeable fraction of cases are found on admission because we aren’t testing elsewhere.
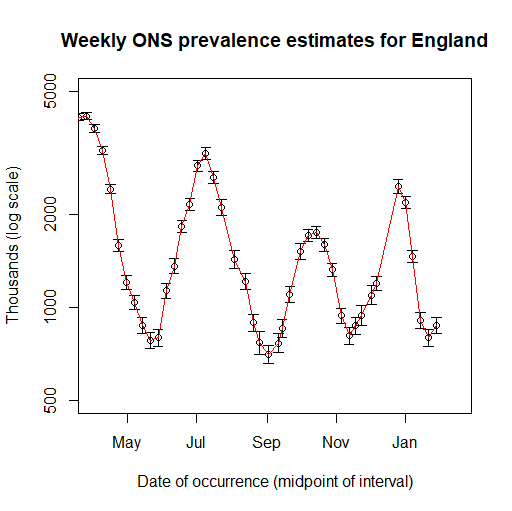
(Midday 10/2/23) ONS also showing a return to growth, but too early to get much of a sighter on the rate of increase at this stage.