(I’m off Twitter at the moment, partly because I’m busy with the start of term. I also am trying to finish a few projects - including this paper which I just posted on the arxiv. It’s all to do with a slightly more realistic model of group testing for COVID, taking account of Ct values on PCR machines, and came out of a summer project with an extremely impressive undergraduate student who has been keeping me on my toes for the last 3 months).
However, there seems to be some doom and gloom in certain quarters regarding the state of COVID in the UK and elsewhere, so I thought it was worth drilling down into that a little bit. For example, yesterday’s hospital admission numbers weren’t great (showing a 31% week-on-week rise), but I think we are at the stage where it’s reasonable to ask how long this trend might continue for.
So here are a couple of slightly optimistic graph-based straws in the wind.
A lot of attention recently has focused on the new BA.2.86 variant, partly based on the number of mutations it has. While there’s starting to be more lab-based biological data about it, that’s not at all my area of expertise. However I think it’s possible to be reasonably optimistic about the trajectory of this variant, given the data from Denmark, which was one of the earliest places that it was discovered:
There’s wide uncertainty on each of these points, because relatively small numbers of cases are being sequenced. But remember that standard models suggest that we would expect them to be going up roughly as a straight line, with the slope representing the growth advantage of the new strain. Well, if you squint, perhaps they are climbing a little, but it’s certainly not a knock-out rapid growth effect like we saw with original BA.1.
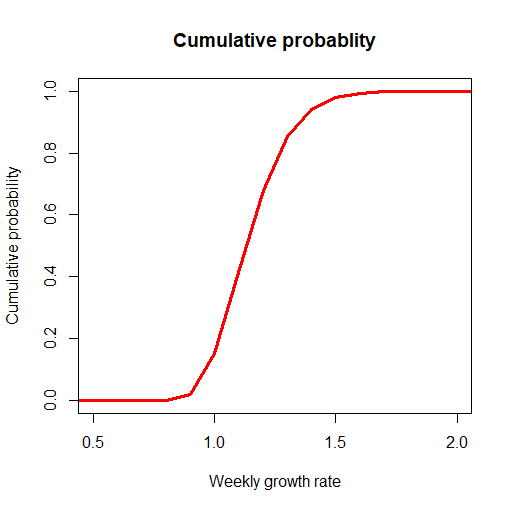
In fact the growth advantage maybe seems smaller than other omicron strains that took over recently. If I do a maximum-likelihood estimate of advantage in Denmark, I get something like 15% weekly growth (and remember that BA.5 for example had 15% daily growth). And a plot of the Bayesian posterior looks something like this - under this (albeit relatively simple model) it seems hard to argue that BA.2.86 is growing more than say 50% per week in Denmark in the current data.
So that’s good, but what about the current wave? A lot of the recent growth in the UK has been caused by the EG.5.1 variant growing in market share - and looking at the recent data it is perhaps possible to be a little bit optimistic that this growth might be slowing down. The confidence intervals on the red points are somewhat narrower here (at least lately), and I think it’s possible to think that (just like XBB.1.16 did before it - left for reference) there’s a chance that the growth of EG.5.1 isn’t as fast as it was before.
Meanwhile, there are straws in the wind (or rather the water) from the fact that recent growth in COVID cases in wastewater in Scotland and the USA appears to peaked and perhaps even gone into reverse. (Though personally I think the recent volatility of the Scottish wastewater numbers is a reminder that you probably shouldn’t put too much weight on any one week of this data. Similarly while there’s a suggestion from recent ZOE numbers that the incidence estimates might not be growing as fast as they had been, I’ve always been a bit ZOE-sceptic in general, so it would seem somewhat hypocritical to suddenly leap on that as evidence of a slowdown!)
Of course, this might not be a huge shock. For at least the last 18 months, we’ve seen that a succession of omicron waves have come and gone. While it’s always possible to run predictions of exponential growth forward long enough to make the numbers start to look scary, there’s been a strong tendency that waves with a smaller growth advantage tend to peak at a lower level. And it’s worth remembering that EG.5.1 itself wasn’t exhibiting a huge growth rate (perhaps 5% per day when it first showed up), so it wouldn’t be a huge surprise to me to see this wave coming to an end in the next few weeks.
And as usual this time of year, while there will be upwards pressures from the return to schools and more indoor socialising, we can also hope that the effect of the latest booster campaign targetted at the vulnerable will keep COVID deaths not too far above their recent historically low levels, even taking into account lags from infections to death and in reporting.
Of course, this optimism may not date well - all kinds of things can always happen! But as usual my feeling is that any predictions about the future COVID trajectory need to come with a healthy dose of humility and uncertainty, and that anyone confidently predicting a certain return to doom and gloom might want to consider some of these other factors as well.
Anyway, if you found this interesting, do please share on Twitter, Bluesky, Threads, Mastodon or anywhere else, and if you didn’t already then please consider subscribing to guarantee receiving future updates from me.


> there’s been a strong tendency that waves with a smaller growth advantage tend to peak at a lower level
At risk of pointing out the obvious, under reasonable models both the initial growth rate and peak height are monotonically increasing in the initial effective reproduction number. So this follows from theory too.