I started this Substack as a way of archiving some of the pandemic threads I posted on Twitter. This was firstly for ease of future reference for me, but secondly because Twitter didn’t seem entirely secure as a record (for example because accounts could get banned at a whim). Anyway, this is a thread I posted on 9th October 2022 about the “Russian roulette” model of Long COVID, and why I don’t think it stands up to real-world data. The graphs and thread are posted unedited (not that I’d really want to change anything), one paragraph per tweet, but I add some extra updated context at the end.
I think some people have maybe got the wrong mental picture of Long COVID risks, and how they have changed over time (with vaccination, reinfections and the arrival of Omicron). Thread.
First, the usual kind of disclaimer I put on these threads. Nothing that follows is meant to minimise the very serious consequences for people who already have Long COVID, who have nothing but sympathy from me.
What I'd like to talk about is the "Russian roulette" or "rolling a dice" model. That is, the idea that every time you get infected, there is a constant chance (independent of previous experience) that you will develop Long COVID, and if so you will never recover from that.
Now if that was the case (or worse still, if the risk increased per infection) that would be really bad, and would justify the most severe COVID suppression measures IMO.
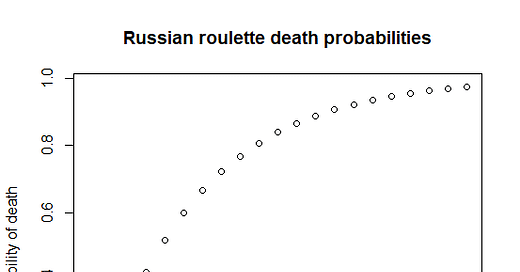
For example, here are the chances of death over time if you keep playing Russian roulette (1 in 6 chance of death each time). It's not pretty.
Now, before I'm accused of attacking a strawman, here is a corresponding graph that purports to give cumulative Long COVID risks, which was RTd hundreds of times. This is based on identical maths to the Russian roulette example ("think of it as rolling dice").
So, we really ought to figure out if that ("independent constant chance of LC per infection, with no recovery") is happening. Luckily, in the UK we have good information on this, based on ONS infection survey and ONS Long COVID prevalence data.
I'm going to focus on the most severe kind of Long COVID - that is "people reporting their ability to undertake their day-to-day activities had been limited a lot".
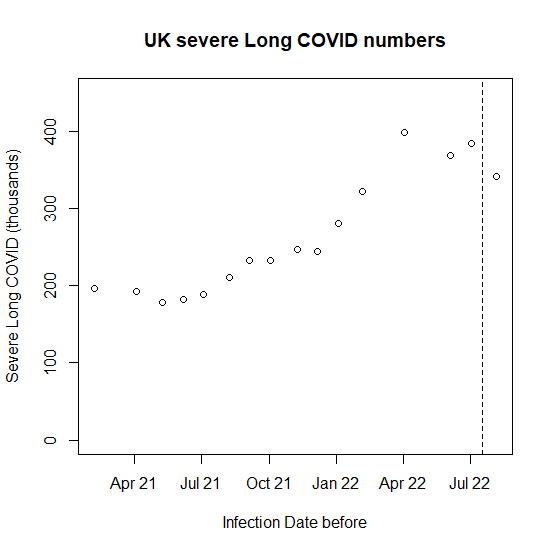
The first time this was reported (link here) there were 196,000 people in this category already. This was for the 4 week period ending 6th March 2021, based on infections at least 4 weeks previously. So this is a kind of "pre-vaccination" figure.
Of course, we don't know for sure how many people had been infected by that time, but the MRC-BSU estimate it was about 12 million in England alone (link here) which suggests about 1.5% of cases up to then converting into severe Long COVID at that time.
Under our Russian roulette model, we'd expect cases to keep converting at this rate. There's been an absolute shedload of infections since, and so if they all converted into permanent Long COVID with the same probability as before, the curve of severe LC would look like this.
Total infections were up by a factor of 5 or so by July 2022, so we'd expect total cases of severe Long COVID to do the same, if the Russian roulette model were true.
This is not what we see (values extracted by hand from webpages here, change in methodology affects points after dotted line). Numbers are up since we first started looking, but by nothing like as much as the Russian roulette model suggests.
It's hard to know about conversion rates, because there must be some churn (new people join the group, old people leave) - but it's notable that even ignoring the change in methodology, points were down, not climbing in the same proportion forever.
Overall though, it seems clear that infections aren't converting into severe Long COVID at anything like the rate they were before. Of course, you may take the view that any risk is too high, and avoiding COVID if you can still seems like a good idea.
NB Not a biologist, so not going to speculate about the reason for any of this (beyond pointing to this XCKD cartoon about vaccination. /FIN
Update (18/12/22) As I say, I think this analysis stands up fine a couple of months later, and I really wouldn’t want to change much about it. But just a couple of extra things:
Updated versions of the graphs are available - the latest (13th December) version of the MRC model now estimates just under 90 million total infections (so another 20 million since the 5th August version that I posted above). Despite this, the latest ONS severe Long COVID data shows total numbers affected still in the 300-400k territory.
Interesting data from Switzerland published in a paper, showing prevalence of Long COVID-type symptoms about 1.3% higher in "infected” group than “control” group in the Omicron era, 12 weeks post infection (the ONS data starts counting at 4 weeks).


MRC model URL has changed at 04Nov2023:
https://www.mrc-bsu.cam.ac.uk/now-casting/report-on-nowcasting-and-forecasting-13th-december-2022/