
Reverting to type
It ain't me, I ain't no millionaire's son

Things have been a bit crazy for me on Substack lately. A couple of weeks ago I posted a maths-based piece about network flow, which somehow clicked with a lot of people. All of a sudden I gained more than 900 subscribers in a fortnight, more than I’d managed in the whole of the year before that.
On one hand, that’s great. Thank you new subscribers, it’s lovely to have you here! On the other hand, I’m sorry that it might well be a disappointment for you. This isn’t just British false modesty. It all comes down to a well understood mathematical principle, so before you all unsubscribe again, I might as well tell you about that.
Imagine someone writing a weekly (or so) email newsletter. Let’s call him Professor J. Like everyone, he’s only human, and so the stuff he writes varies a lot in quality. Occasionally Professor J’s newsletter is full of interesting insights. Most weeks, it’s a complete clunker and he might as well not have bothered.
Now, suppose that Professor J is connected to a variety of social networks. People might forward his newsletter directly, or share it on this week’s latest hot site. The key is that this is likely to be influenced by the quality of the newsletter. It won’t be perfect, but the chances are that a boring newsletter will sink without trace, and the interesting ones are more likely to benefit from these sorts of network effects.
Assuming that the newsletters which go viral tend to be the better ones, Professor J is likely to gain more subscribers off the back of an interesting piece. Now, see it from the point of view of a new subscriber: they arrive with high expectations having first been exposed to Professor J through one of his rare good newsletters. The chances are that just by random luck the next few things they read will be much worse than that. Like I say, they’re going to be disappointed.
This is an example of what’s called regression toward the mean. It’s an idea with a bit of a murky history, originating with Francis Galton. We can argue all day about how much it’s fair to judge past generations by current moral standards, but nonetheless it’s clear that Galton was the father of eugenics (in its original sense of trying to breed out “undesirable” traits from the population, not the modern sense of going out to brunch in 2024 without a mask).
Because Galton was obsessed by heredity, he collected data on heights of parents and their children. And because for all his faults he wasn’t stupid, he discovered something interesting. As you might expect, taller parents tended to have taller children, but the relationship wasn’t perfect. In fact, for each inch taller than average parents are, their child tended to be two thirds of an inch taller than average.
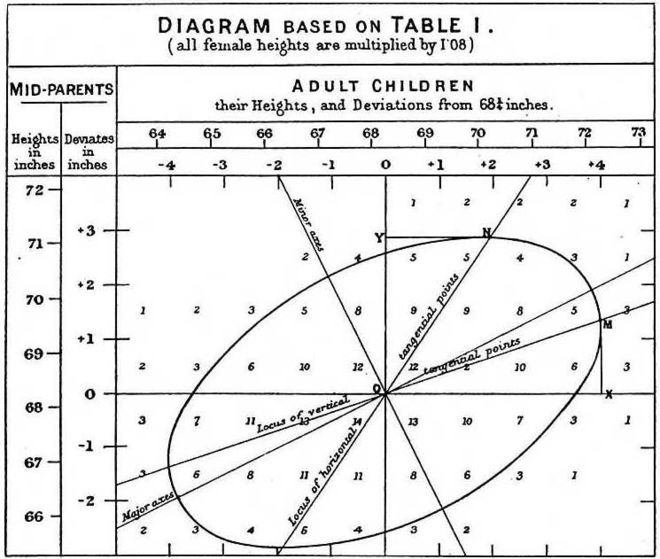
And it worked the other way as well. For each inch shorter than average the parents were, the children tended to be two-thirds of an inch shorter. In each case, just as interesting newsletters are likely to be followed by boring ones just by random chance, the children of “extreme” parents (in either direction) tended to be closer to the average than them. This is regression toward the mean.
In fact, this led to one of my first ever “maths interventions in public debate”, on a matter related to speed cameras. The problem is that cameras will be located at past accident blackspots, for example places with a certain number of injuries over the past 5 years. A naive analysis would count the number of accidents over the next 5 years, conclude it has gone down by a certain percentage and conclude that the camera worked.
However, we need to be careful. Precisely because we’ve chosen to locate the camera where lots of accidents already happened, it’s possible that this is just a place which had an unusual number of crashes by random chance, and things would have got better anyway. Early in my first postdoc position I had a letter published in The Times making this point sometime around the turn of the century, which led to an MPhil project with data from Cambridgeshire County Council. In the end my student published papers which show that if you do the analysis properly then an effect does persist, and that speed cameras do reduce accidents, but not as much as the naive analysis might suggest and that these regression effects matter.
Another place where regression towards the mean often crops up is in sporting achievement. There’s something called the Sports Illustrated Cover Jinx, which suggests that being chosen to appear on the magazine’s cover leads to a drop in performance. However, it’s pretty plausible that regression towards the mean is at work here too. As with the speed cameras, people are chosen as the cover star on the basis of a striking and unusual run of performances. Of course, they may just be excellent performers overall, but at least in some cases it must be believable that luck has put together a run of success which wouldn’t have continued in the long-term whether or not they were chosen for this honour.
It’s even possible to try quantify these kinds of effects, if we look at the recent form of Manchester City’s Nordic goal robot Erling Haaland. At the start of the season, people got excited as he scored 10 goals in his first 7 league games, leading to breathless suggestions that he could demolish the Premier League record with a total of 54 goals in the season. Since then, things have dried up, with 3 more goals in his next 8 games.
So, which is the real Erling Haaland? The unstoppable goal machine of August and September, or the more faltering performer we’ve seen recently? Well, my view is that it’s both, or neither. The high or the low rate don’t really feel like a measure of Haaland’s true performance, and overall they balance out to a rate of 13 goals in 15 games which is very consistent with the 63 League goals in 66 he scored in his first two seasons. Overall, it feels like he’ll likely regress close towards this overall mean, whatever the fluctuations might be on the way there. As The Man said, “Form is temporary, class is permanent” (and he’d know).
In general, because somewhere in Europe there’ll always be someone on a hot streak early in a season, it’s fairly easy to generate an article (“Will Gyokeres match Messi”) based on a small sample size, but in practice these predictions tend not to map out over the whole year.
There’s at least one respect in which newsletters are more complicated than heights, speed cameras or goals though. In those cases there is a single number that we care about and can try to understand. However, writing a Substack is more nuanced because different people want different things, so there’s not a single measure of “quality” and personal taste matters a lot.
In my case, I’m conscious that some people want lots of mathematical detail, but others aren’t so technical. Many of my readers are based in the UK and so might appreciate local stories, lots of them aren’t. Some people probably prefer a political slant that they personally agree with. It’s probably impossible to keep everyone happy, and there’s a potential for regression towards the mean in any one of these aspects to put people off.
I have a sense that writers, and creators in general, respond to this in one of two ways. We might call the first the Marvel Movie approach: find a particular formula that works, and stick to it ruthlessly. The second is the Taylor Swift route: don’t get pigeonholed as a country star, but keep moving via pop, EDM, cottagecore, and so on.
I don’t think there’s a right way or a wrong way to do it. It’s not like both these routes haven’t been wildly successful financially, and I can think of Substack writers whose work I enjoy who fit into both frameworks. But I’ll be honest, I’m probably closer to the Swift model: the Marvel approach can work brilliantly, but I’d rather not get pigeonholed and I have a sense it runs out of steam eventually. Whereas I have a low enough boredom threshold that I’d rather jump around, and dabble in infectious diseases, science vs activism, energy politics, sport and all the rest of it.
So when deciding which Substacks to subscribe to, who to follow on Twitter and so on, the regression towards the mean phenomenon suggests you shouldn’t just decide on the basis of a single viral item, however tempting that might be. It’s much better to take a look at a run, get a sense of the form, decide if it’s a Marvel or a Swift. But if you’ve done that, and you’re still here for a longer haul, then welcome, that’s great!
I'm here for the long run. One under estimated consequence of the recession to the mean is in reward and punishment. Take a sales force as an example. Top performer gets a bonus, but next month they don't do as well. Management thinks bonuses are a waste of money. Bottom performer gets a bollocking and the performance improves, so management think that is the way to improve performance. The same scenario posts out in schools and politics all the time.
Another long timer here! Your mathematical posts remind me so much of my love of maths at school - delivered via School Mathematics Project which, in my mind, linked maths to the real world - (although I’ve yet to meet an alien that doesn’t have 10 fingers and therefore the need to be able to count in different bases other than 10) . But I also like your more ‘observational ‘ posts where you talk so much sense- but maybe I’m following my own unconscious bias! Who knows!