UK COVID data, week starting 13th February
There's a slow, slow train comin' up around the bend

(9.20am 16/2/23) Again, I’ve had a busy week so no non-COVID Substack post I’m afraid. But just a reminder that it’s two weeks until Numbercrunch comes out ..
Anyway, I was pleased to see acknowledgement that the Russian roulette model of Long COVID doesn’t stand up to data. To be honest I think the “it’s possible that”, “may have” and “moderately reduce” in the original quote are underselling the size of the observed effect, but it’s a start.


Anyway, as discussed recently, we are currently in a phase of growth in COVID numbers, albeit a slow one. I suspect that this is now being driven to a large extent by the XBB.1.5 variant. This is the one that some people got very excited about around the New Year, and while I said at the time that some of that commentary was hyperbolic …
… it was still clear that it had some sort of growth advantage. And indeed, since the New Year the share of XBB.1.5 has been growing extremely consistently on logistic axes (albeit not as steeply as some previous variants, or as steeply as it seemed to be in late 2022), and so about a third of sequenced cases are now made up of this strain.

So based on these variant shares, the expectation would be that we would be in a slow growth phase. And indeed, that is exactly what we see from the latest hospital data - admissions are going up, the seven day average is 800 …

.. but the rate of growth is still in “slower than 4 week doubling” territory.

(4.10pm 16/2/23) It may partly be caused by a little bit of a half term effect, but it’s still nice (if not totally surprising) to see the rate of increase of dashboard cases heading back towards 1 again.

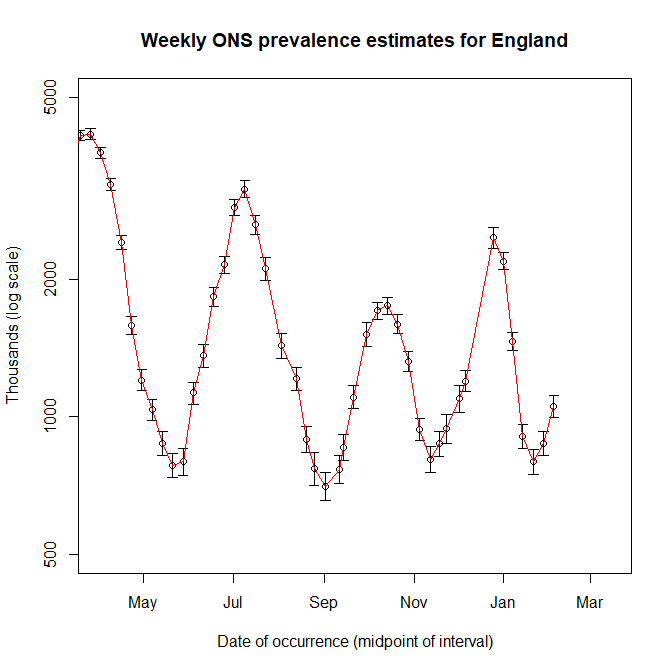
(Midday 17/2/23) As you’d expect (this is data for the week ending 7th February), ONS prevalence showing an increase this week, but relatively low levels compared to previous peaks so far. Interestingly, the rate of increase doesn’t seem to be significantly slower than recent waves (unlike for hospitalisations above, say). I guess this is something to do with the age breakdown of cases and booster status ..