


Did COVID peak before lockdown?
There are more questions than answers, and the more I find out the less I know

In March 2020, having always assumed they wouldn’t, a sequence of Western countries unprecedentedly went into lockdown. Coronavirus infections went into reverse, and the world was saved. Or was it? What if infections had actually peaked before lockdown happened? Was it all a waste of time? Or, in an extreme version of the theory, were governments using a “plandemic” that they themselves had created and exaggerated in order to impose One World Government at the behest of the WEF?
I think we can deal with the last question first. If this really was a plan to deprive us of our civil liberties in the long term, it wasn’t a very successful one. We spent a lot of time arguing about whether you could eat a scotch egg sitting down in a pub if there was a plastic screen across part of the bar. But as I wrote two years ago:
Someone waking from a November 2019 coma might be hard pushed to spot that anything has been different in the meantime. Except … on Twitter. [Ok, now also on Bluesky, I expect]
But even if there wasn’t a conspiracy, maybe there was a cockup? Perhaps politicians and SAGE panicked and imposed a lockdown just at the point where things would have naturally peaked anyway. If so, that would be worth knowing about, as a valuable lesson for the future. But how would we tell?
One good guide to the pandemic trajectory is the curve of deaths. Although the fact that it lags infections makes it too slow for nowcasting, now we are in post-game analysis mode, that’s not a problem. In the simplest case, imagine deaths occurred exactly three weeks after infection: we could just run the clock back three weeks - the infection peak would be three weeks before the death peak, but the shape of the two curves would be exactly the same.
In practice, things aren’t that simple. The average time to death might be about three weeks, but in reality deaths are spread out over time according to some probability distribution.
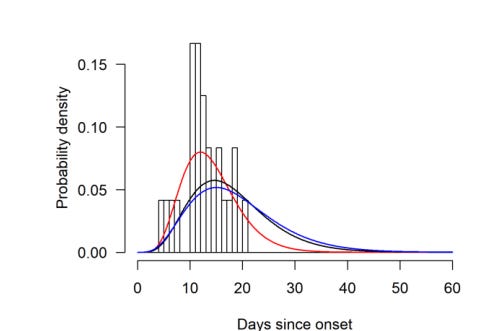
The effect of this is to smear out the infection curve in time - if infections are relatively tightly peaked, deaths will have a wider and delayed peak. However, if we know the infection curve and the delay curve then we can take the convolution (kind of adding them together) of them to generate the death curve. In fact, with a bit more clever maths you can go the other way: if you know the death curve and the delay curve, you can deconvolve (kind of subtracting one from the other) to get the unknown infection curve. This is neat!
As long ago as May 2020, Simon Wood (then my colleague in Bristol, now in Edinburgh) did this analysis and came to a perhaps surprising conclusion: infections did indeed appear to have peaked before lockdown. As you might imagine, this gained a certain amount of attention in venues with a lockdown sceptic bent, like The Spectator. But whatever you think about the politics of the venues that picked it up, since Wood literally wrote the book on fitting curves to data, these are claims worth taking seriously.
Five years on, it feels that there might actually be a rare case of light rather than heat emerging from a discussion about COVID. Wood and co-authors recently presented a new paper at a discussion meeting of the Royal Statistical Society, which includes these claims about lockdown timing. As part of this process, anyone can make their own short response, and I highly recommend reading through some of them.
It feels like there’s a real range in quality: actuary Stuart McDonald gives a valuable breakdown of Wood’s claims around excess deaths, while John Ioannidis simply asserts that lockdown measures killed more people than COVID. And it’s always a pleasure to read David Spiegelhalter’s writing. But I want to focus on four responses to Wood’s claims about lockdown timing, and summarise the counterclaims.
The timing is very tight
With the benefit of the zoom tool, Alex Selby homes in on the timing of the curves, and argues that if the peak was before lockdown then it was very close indeed, perhaps a day or two at most. As he writes
Given this virtual dead heat and modelling uncertainties, it seems too much to conclude that “R<1 clearly before the first lockdown”.
Deaths are not infections
Mike Tildesley makes another important point. You can’t infer the trajectory of infections from deaths. You can only infer the trajectory of fatal infections, which as we know were greatly concentrated in the old. So even if Wood’s analysis is correct, it may only be telling us that infections peaked before lockdown in the old, and very little about the spread in the general population. The fact that these infections might have peaked early isn’t too surprising, because we know that the old and vulnerable were particularly encouraged to take measures before the rest of us.
Had spread continued to grow exponentially in the general population, to reach a situation where 10 or 15% of them were infectious, it’s not hard to believe that this would have leaked through to the shielding population, into care homes and so on, at a time when we didn’t have sufficient tests to work out who was infected. This could easily have led to a second peak of deaths, soon after and perhaps even higher than the first.
Deconvolution methods are tricky
A more technical, but extremely valuable, contribution comes from Verity, Cori, Mishra, Flaxman and Bhatt. They argue that these deconvolution methods are based on statistical assumptions about the infection curve, that it is relatively well-behaved. They show what they admit is a contrived example, but which is certainly provocative:

In a (unrealistic) situation where the true curve of infections (blue) crashes to zero, because the deconvolution method has a preference for smooth curves, it comes up with a black estimate which pulls the peak five days earlier. Given that (as Selby said) we are arguing about a matter of a day or two, this is certainly a concern.
Maybe it doesn’t matter
My own contribution to the discussion was to argue that we shouldn’t get too hung up on the timing of the peak. What also matters is the shape of the peak - and specifically the rate of exponential decay after it.

In an illustrative example, if instead of falling 28% per week in the winter 2021 lockdown, deaths had only fallen by 10% per week, we would have seen an extra 32,000 deaths in a three month period. Of course we can argue about what the true rate of fall would have been without lockdown, but for me it seems clear that we can’t just argue about whether R was less than 1, when we wanted it to be a lot less.
This isn’t a pro-lockdown point per se, I end up arguing that
the optimal strategy may involve short and intense periods of maximal suppression
as perhaps envisaged by the original Imperial Report 9.
What’s next?
Nonetheless, I think it’s important and valuable to have these discussions. The RSS read paper has already facilitated some interesting contributions, and I will be keeping an eye on the journal feed for more in the next few days.
In due course, Wood and co-authors will get a chance to respond to all the discussion points raised, and I’ll be interested to see what they say. But already I feel that it is a positive development to have these discussions in public, in the scientific literature, mostly via evidenced claims, rather than in the bear pit of social media. This seems healthy to me, and the right way to stake out the argument in all its messiness, rather than making tenuous claims that we just need to Follow The Science.
My answer is even simpler: Pretending that lockdown was a sharp cutoff on March 24th is ahistorical bullshit and should be laughed at rather than analysed.
19th March - people told to stop all nonessential contact
20th March - schools close, pubs/clubs/theatres told to close early and remain closed
21/22 March - weekend, so workplaces were shut
23rd March - official full lockdown announced
24th March - date used as the ‘lockdown date’ in bullshit analyses.
26th March - lockdown legally comes into force
So schools were closed by Government order four days ahead of the ‘lockdown date’, entertainment venues ~3.5 days ahead of it, and workplaces were closed for 2 out of 3 days preceding the ‘lockdown date’. That fully and entirely explains any minor discrepancy.
Just like the actual legal changes that came into effect on the 26th, the lockdown announcement on the 23rd was a recognition of events that had already happened.
The link to Alex Selby's response seems to be to David Spiegelhalter's contribution.