
Time's arrow
Heat won't pass from a cooler to a hotter

Two questions. If you grab a few things in the supermarket, what’s the chance that your bill ends exactly in .00? And what’s that got to do with the inevitable heat death of the universe?
The answer to the first question is, as usual, “it depends”. Obviously if you shop in a store where everything costs a whole number of pounds1, then every single time your bill look like this. And similarly if all the prices end in a multiple of 5p then so will your final bill.
But in general, assuming there’s a reasonable range of final digits of prices and that you pick up enough items, then you basically have a one in a hundred chance of a round bill like this. On some level, the reason for that is symmetry - there’s no particular reason why any particular pence value is more likely than any other.
As a result, we might expect that all the final pence values would be roughly equally likely. Because there’s a hundred of them, the chance of a .00 outcome must therefore be one in a hundred. (In the “everything is a multiple of 5p” case, there are twenty possible values, and the chance is one in twenty).
This “everything has the same chance” collection of probabilities is called the uniform distribution, and it’s really important. But what might be surprising is how easily we reach it, and how few items we need to pick up in a supermarket to make it appear. The key thing is that when you pick up each item, it spins the wheel of the final digits by a sort-of-random amount, mixing things up a lot.
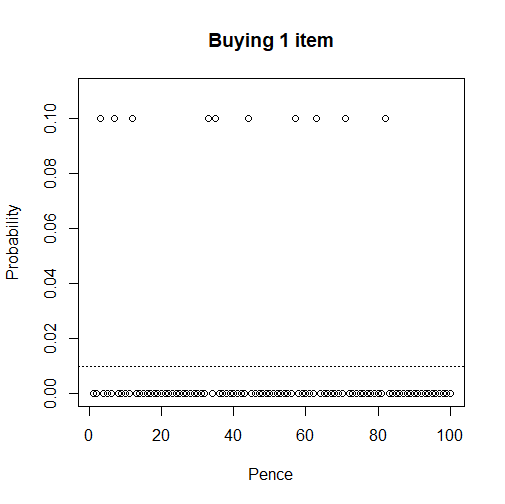
We can plot some graphs to show what I mean. Imagine a supermarket with only ten items, which cost 3p, 7p, 12p, 33p, 35p, 44p, 57p, 63p, 71p and 82p respectively, and where we are equally likely to pick each one of the items each time we take something off the shelf. If I only buy one thing, then there are ten values for the pence value of my final bill, and the graph looks quite lumpy:
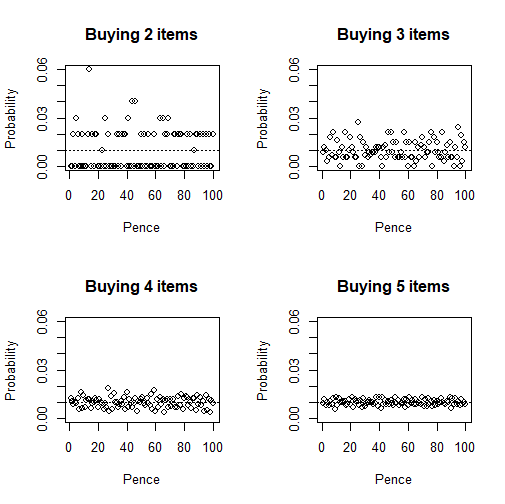
But now if I buy two items, I start to put these numbers together in different combinations. All of a sudden there are a lot more possible pence values. I can work out the chances of each one by an operation called convolution2 and plot the graph of that. What you’ll see is that if I successively pick up two, three, four and five items, the graph flattens out really fast, and that with as few as five items the dotted line of the uniform distribution gives a really good approximation:
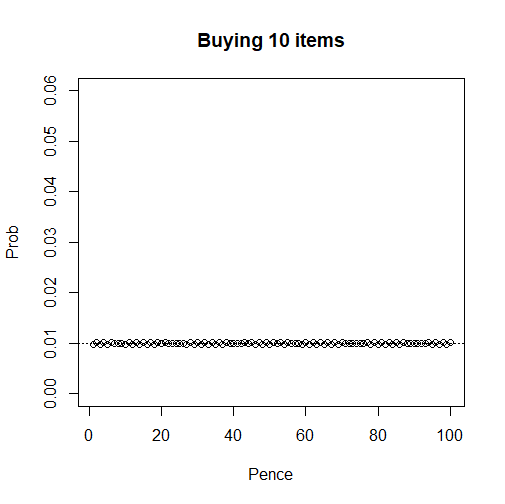
In fact, Logging the World fans will be happy to hear that we get close to this dotted line at an exponential rate. By the time we have ten items, the outcome is essentially indistinguishable3 from uniform. Calculation tells me that every single probability lies between 0.974% and 1.026%, so saying they are all 1% is a really good approximation:
That’s kind of fun. You might feel like I cheated by picking those particular numbers and making the chances all equal to start off with, but in fact assuming that the differences between the initial prices aren’t all divisible by 2,4,5,10,20,25 or 50 then the same will apply.
In fact this is an example of a much more general phenomenon. If you put probabilities on the kind of group structures which I talked about here then, unless you’ve deliberately tried to avoid it, mixing them together by this process of random independent draws will get us close to this uniform distribution exponentially fast.4
In other words, repeated mixing inevitably draws us towards uniform probabilities. This can be really handy. For example, in a casino, we would like the cards to be perfectly mixed, so that each hand is equally likely and the game is fair. It turns out that, despite the huge size of the possible set of hands, doing about ten rough riffle shuffles will basically achieve this - see Figure 1 here.5
And once you get to uniformity, you can’t get away. Doing more independent random moves doesn’t change a uniform distribution from being uniform. Once things are mixed, they stay mixed, unless you make a specific effort to break them apart - for example by deliberately picking up items to aim for a .00 bill.
Now this might remind you of something. I mentioned the heat death of the universe, and that wasn’t just a crazy Malcolm to suck you in. The Second Law of Thermodynamics tells us that entropy of physical systems increases, that mixing a pint of hot water and a pint of cold water gives you two pints of lukewarm water, and you can’t reverse that. In the same way, neat piles of clean washing will spread themselves out to an equal depth on your bedroom floor, unless you make a specific effort to pick them up.
The interesting thing is that this growth of uniformity really isn’t a coincidence. Just as we can talk about the entropy of the universe, we can talk about the entropy of probability graphs. Spiky graphs like our 1-item graph have low entropy, spread out graphs like our 10-item graph have high entropy, and in fact the uniform graph has the highest entropy possible.
But the most remarkable part is that our shopping process obeys something like the Second Law of Thermodynamics: each time you pick up an item at random, the entropy of the price graph increases. This kind of uniformity is a state that inevitably draws us in, like getting trapped in quicksand or an online discussion about politics.
As a result, what seems like a stupid question about supermarket prices can get us into very deep philosophical water very fast. Next time you are standing in the queue and waiting to unload your shopping, you can think about how the laws of the universe and the laws of probability act the same way, and how we can’t avoid our inevitable destiny of flatness, beigeness and slop. And if that’s not a cheerful enough thought to start the weekend, then I don’t know what is.
International readers are invited to put their own currency in here.
This is exactly the same thing we did when trying to work out whether COVID peaked before lockdown. Good maths ideas are valuable in a lot of contexts!
For example in the sense I talked about when describing Nate Silver’s election models.
This was the subject of my second-ever published paper, back when I was young and fresh-faced.
On the other hand, doing eight perfect riffle shuffles will get you back where you started. Randomness is confusing sometimes! The person you can thank for knowing about all this stuff is mathematician and former professional magician Persi Diaconis.
I used to live near a proper entropy pub - order two of the same pint, and you’d occasionally get a bill than ends in an odd number.
A notable feature of prices is that so many end in 99. This a something of a puzzle for economists: the obvious explanation - that people "see" £4.00 as much higher than £3.99 - clashes with the idea that people are rational; another - that such prices act as an honesty check by requiring the shop assistant to give change and hence put the transaction through the till - seems outdated in an era of plastic. One theoretically more elegant possibility is that rational consumers save on calculation time by assuming all prices end in XX; retailers rationally react to this by setting all prices to end in 99 since this maximises their profits; and consumers in turn rationally react to that by assuming XX to be 99. So it's a reinforcing equilibrium that prices ends in 99.
I'll try to work out what this means for the end of the universe over the weekend.